PRT Bands indicator
Warning: ProRealTime does not provide any financial investment advisory services. All information on this site is "General" information only and is not in any case personal or financial investment advice nor a solicitation to buy or sell any financial instrument. Past performance is not indicative of future results.
PRT Bands indicator
PRT Bands is a visual indicator which simplifies detecting and following increasing market trends. This indicator is only available from ProRealTime.
PRT Bands may help you to:
- identify trend reversals
- identify and follow rising trends
- mesure the intensity of a trend
- find potential entry and exit points
This indicator was designed for use with stocks that may have high bullish potential such as small and medium caps or technological stocks. It is used primarily with long chart timeframes (ex: daily or weekly).
Add PRT Bands to your charts
To add PRT Bands to your charts :
- Click on the "Price" label at the top left of your chart, then on "Add indicator".
- Select "PRT Bands" from the list of predefined indicators.
You can also add PRT Bands to a chart by right clicking on it, then "Add Indicator" or by clicking on the "Indicators" button at the bottom of your chart.
You can then configure the PRT Bands display settings by clicking on the "PRT Bands" label at the top left of your graph and then on "Configure".
Detect the beginning of a trend
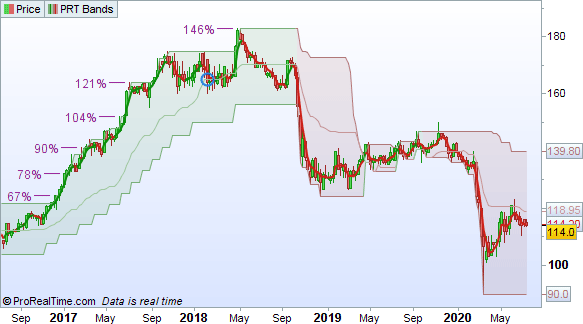
When the price breaks out of the top line of a bearish channel of the indicator, the beginning of a potential bullish trend is detected.
The possible change of the trend from a downward trend to an upward trend is indicated by the change of color of the trend lines from red to green.
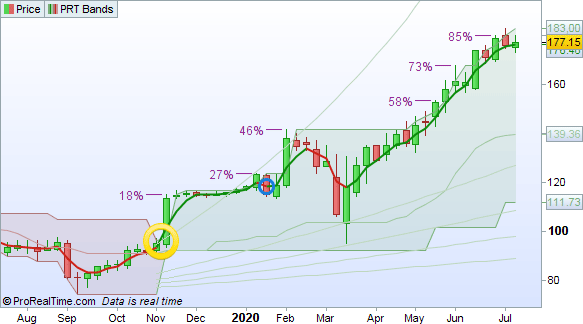
View current upward trends
When the price is inside a green channel, the trend of the security is upwards. An upwards trend is caracterized by its capacity to regularly make new highs. Statistically, the trend tends to continue.
If you do not have a position, it may be an opportunity for you to enter this trend by identifying the entry point the most adapted to your own strategy and investment objectives and to try to benefit from its future progression.
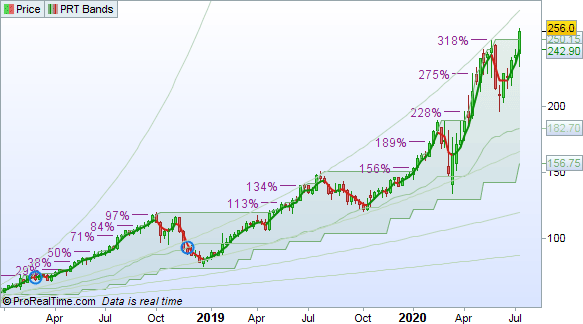
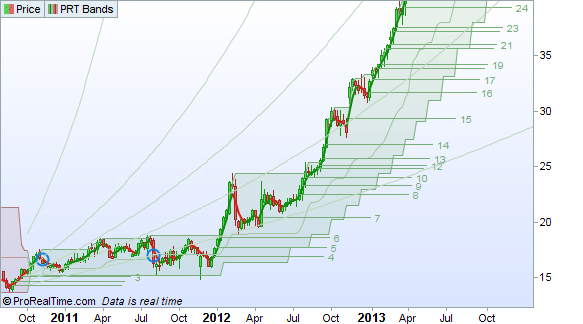
The levels of the rising trend can be viewed as a percentage of progression (shown above) or as horizontal lines showing new bullish levels (shown below). A new bullish level is added when price closes above this level during 40 candlesticks. Each new level is associated with an increasing number. New bullish levels can be enabled in the options of the indicator.
Don't catch a "falling knife"
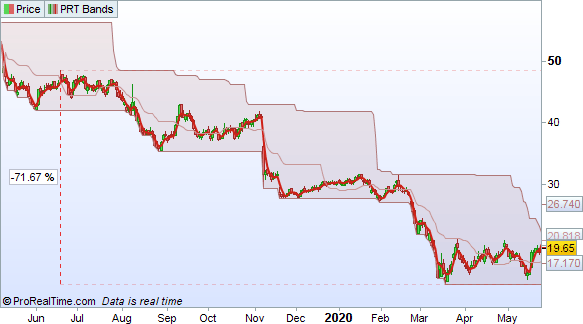
We have a tendancy to see a security whose price has "fallen enough" and to try to find a support which could hold in order to buy at a low price and hope to sell again at a higher price.
But we also have a tendancy to forget that in the absence of a strong bullish signal, a downward trend can continue for a long time.
With the indicator PRT Bands, as long as the price stays within a downward band, we could interpret that a trend reversal has not necessarily happened and opening a buying position could be dangerous.
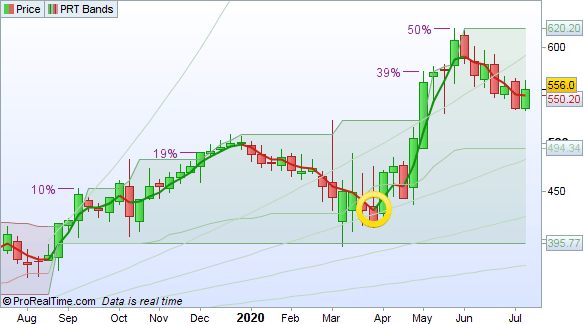
Find an entry point with the short-term line
The indicator displays a short term trend line which stays close to the price movements and allows you to better filter price fluctuations.
During increasing trend phases, stocks sometimes experience movements of price consolidation. This case will be represented by an increasing channel (underlying trend), but with a decreasing short term line.
When this short term line is increasing again, it could be possible to look for a point to enter the underlying increasing trend.
Follow the mid-term trend
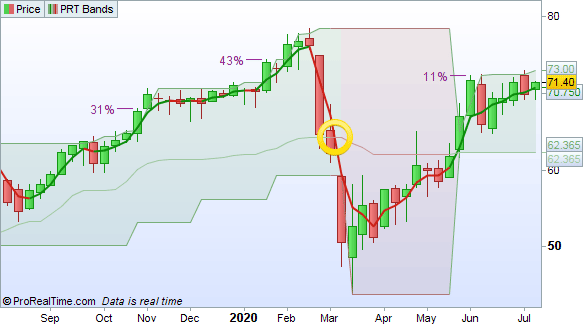
In the middle of a channel, a bold line is displayed. This line represents the mid-term trend.
When the short term line which closesly follows the price crosses under the mid-term line, it can indicate a weakening of the trend. This can be an opportunity to reduce the size of a position or possibly close it.
Also, when the short term line crosses over the mid term line, it is possible to look for a point to enter the trend.
Quickly measure the progression of the trend
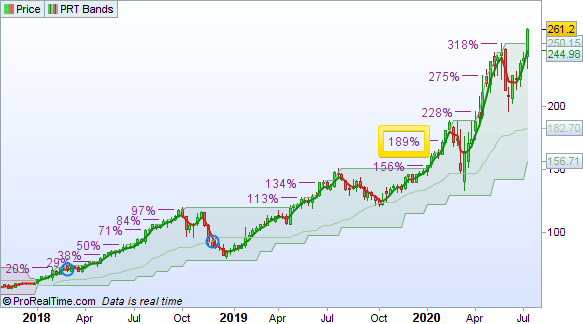
In order to avoid using a different tool to measure the progress of the trend, it is regularly displayed, as the trend progresses.
This is also a feature which has a psychological impact and can encourage you to hold a winning position while the trend continues to be good.
Quickly evaluate the speed of the trend
The indicator also displays a set of 5 lines showing the speed of the trend. These lines serve as a reference.
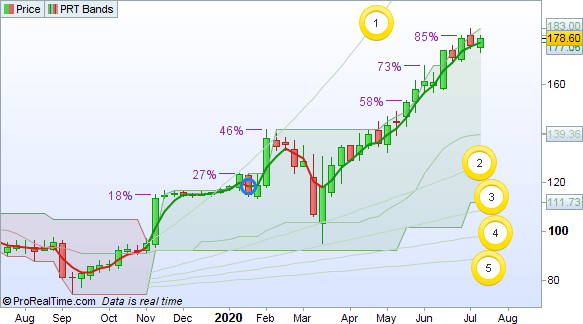
In this way, a trend which follows or crosses over the first line would be considered very fast, and a trend which is underneath the 5 line would be considered very slow. Some investors may prefer to enter the market in a faster trend.
Weakening of the trend
The indicator indicates by blue circles zones of potential weakining of the trend. These blue circles can be used as elements of your consideration if your money management strategy includes taking partial profits.
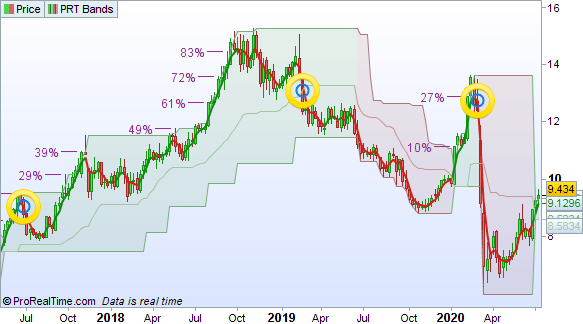
Consider leaving the trend when it is giving the impression of weakening further
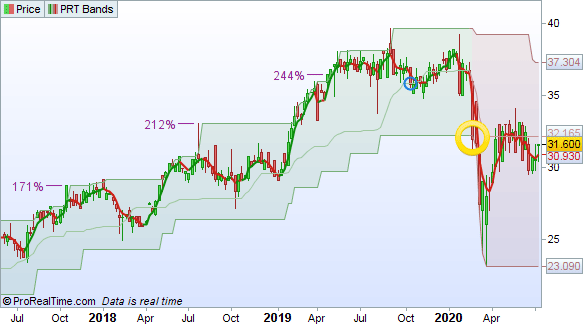
Did you benefit from a nice rising trend for several weeks or months or years? The next step is to figure out when to leave the trend. The bullish trend when it weakens can leave space for a bearish trend.
The possible change of trend from increasing to decreasing can occur when the price closes on the bottom of a channel. This change is represented by a change of color of the trend lines from green to red.
Programming with the PRT Bands indicator
In addition to the default indicator, 4 new programming instructions associated with it are available in the platform. These instructions are :
- PRTBANDSUP - returns the highest PRT band
- PRTBANDSDOWN - returns the lowest PRT band
- PRTBANDSMEDIUMTERM - returns the medium term band
- PRTBANDSSHORTTERM - returns the short term band
These instructions can be used in programming your own indicators or to create your own screeners. Here are some examples of programs you could create :
- Plot an up arrow on the chart below the candlestick when the Close crosses over the upper band
- Plot a down arrow above the candlestick when the Close crosses under the lowest band
- Create a market screener that lists all shares that mid term band is suddenly ascending after staying the same price for the last 5 bars
- Create a market screener showing shares where the short term band just made an ascending hook
To see examples of these programming instructions and discuss programming using this indicator, we invite you to have a look at the PRT Bands indicator thread on the ProRealcode forum or the PRT Bands indicator programming instructions help pages.
