Indicators & multi-timeframe
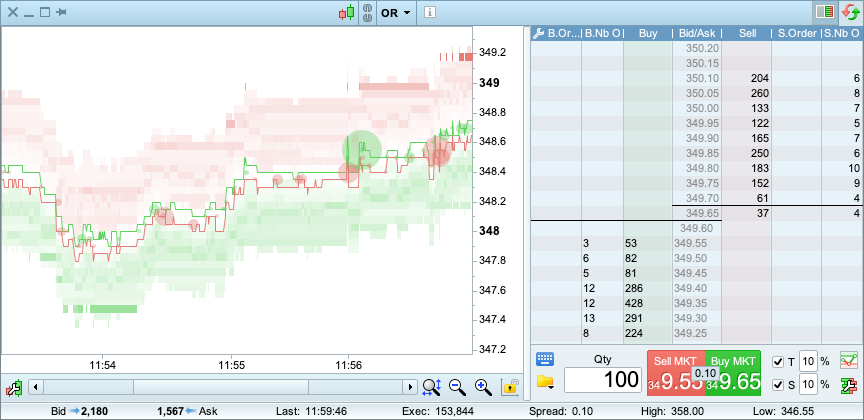
New Volume Profile Indicator
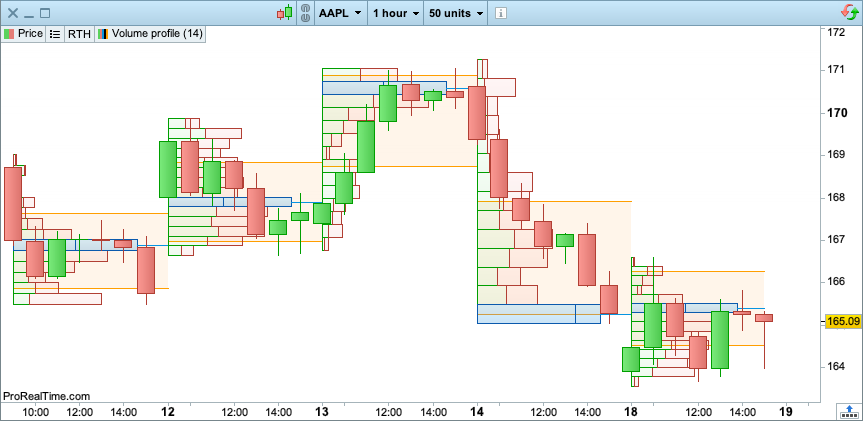
Volume Profile allows you to see the volume distribution across all price levels directly on your price charts, and identify easily the price levels with the highest volume traded.
Multi-timeframe available for all indicators
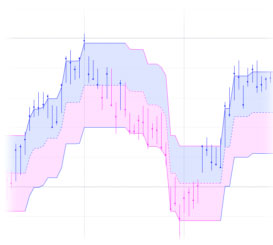
All indicators of the platform can now be displayed on a different timeframe than the one they are calculated in (example: Display a daily moving average on a 1 hour chart).
Improved VWAP indicator
More historical data available and this indicator is now calculated tick by tick. You can also choose between a daily period or a sliding period in minutes.
Calculate indicators in heiken ashi view
When displaying a chart in the heiken ashi view, you can choose between calculating the indicators shown on the chart based on heiken ashi candles or on regular candles (OHLC).
