Market Profile ®
Wat is een Market Profile?
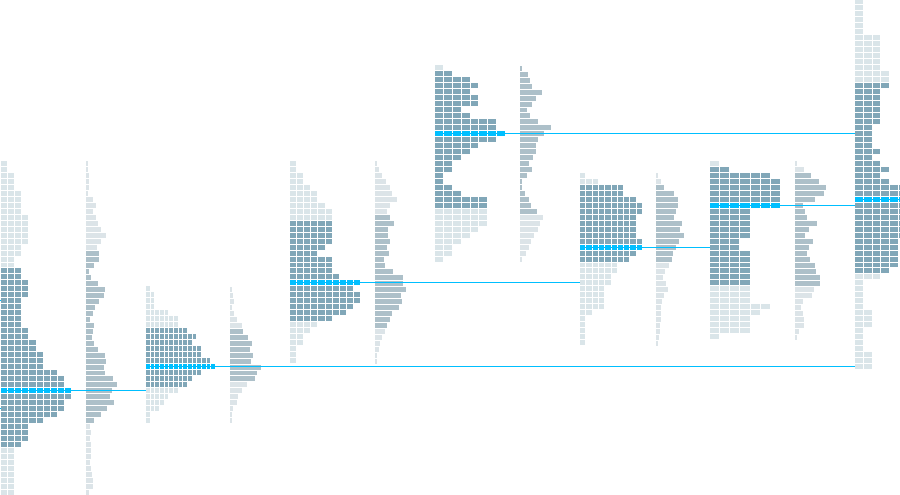
Een Market Profile® (ook wel bekend als “Time Price Opportunity” of “TPO”) is een grafische weergave van marktprijzen
Het bestaat uit boxen die de niveaus weergeven die de prijs van een financieel instrument gedurende een bepaalde periode (meestal 30 minuten per box) heeft bereikt.
Door deze boxen te stapelen, kan men belangrijke koersniveas identificeren, maar ook de boxes die het vaakst en het minst door de markt zijn bereikt.
Elk profiel stelt meestal 1 handelsdag voor.
Vaak wordt het getoond naast een Volume Profile, welke het totale uitgevoerde volume toont per koersniveau.
Deze weergave wordt vaak gezien als eenuitgebreidere dan traditionele candlesticks, omdat het een directere visualisatie mogelijk maakt van:
- de koersniveaus die het meest zijn bereikt door de markt en welke het minst,
- de koersniveaus die voor een langere periode zijn getest door de markt zonder te zijn doorbroken,
- de koersniveas die nog niet lang getest zijn door de markt.

De onderdelen van een Market Profile
Een Market Profile bevat doorgaans de volgende elementen:
- het tijd-koers profiel, bestaande uit boxen die prijsbewegingen voorstellen,
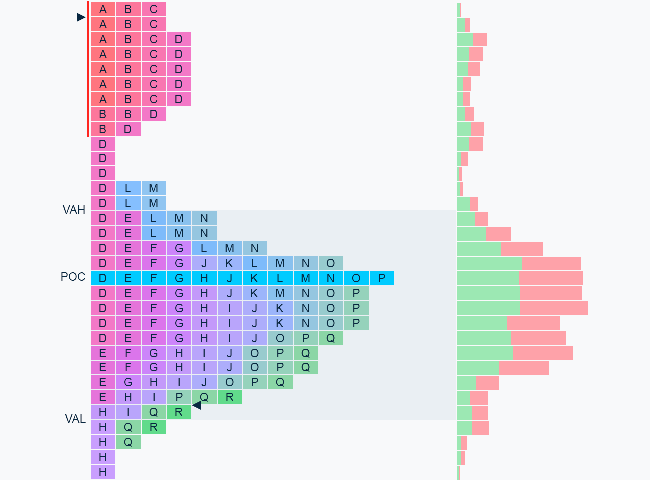
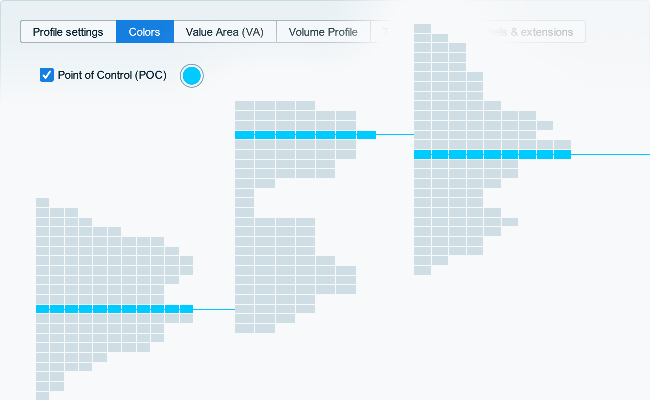
- de Point Of Control (POC), overeenkomend met de niveaus waarop de marktprijs het langst bleef,
- de Value Area (VA), waar de marktprijs het grootste deel van de tijd is gebleven (doorgaans 70% van het profiel),
- het Volume Profile, die de totale volumes weergeeft die op elk prijsniveau zijn uitgevoerd.
Via de ProRealTime Complete en ProRealTime Premium platforms, kunt u ook:
- de Initial Balance (IB) tonen om prijsbewegingen bij de opening van de markt snel te identificeren,
- verlengingen trekken voor Singles,
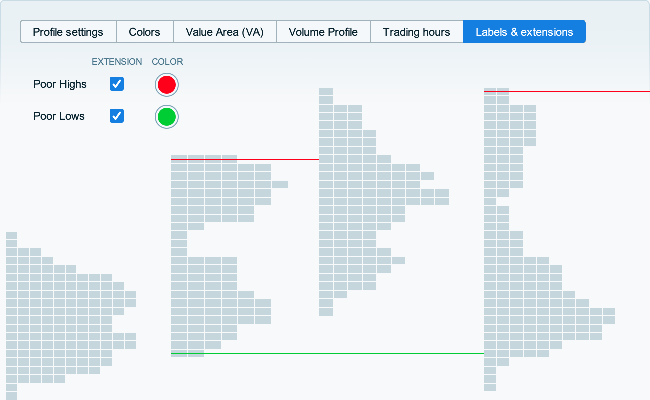
- Poor Highs en Poor Lows detecteren.

Boxen
Elke box geeft de bereikte prijsrange aan voor een bepaalde periode.
In tegenstelling tot traditionele candlesticks hebben Market Profile-boxen een vaste hoogte: als de prijs snel verandert, worden er meerdere boxen voor dezelfde periode weergegeven.
Elke periode wordt aangeduid met een andere letter (A = eerste 30 minuten van de dag, B = volgende 30 minuten, enz...).
 price
candlestick
box
Opbouw van het profiel
Standaard worden letters gegroepeerd: boxen die overeenkomen met dezelfde prijsrange worden gestapeld.
Met deze weergave kunt u snel zien waar de markt het langst bleef en op welke prijsniveaus het minst.
U kunt de letters van elk profiel afzonderlijk groeperen/degroeperen door er met de rechtermuisknop op te klikken, of het betreffende vakje in de indicatorinstellingen aanvinken/uitvinken om alle profielen die in de grafiek worden weergegeven te groeperen/degroeperen.

De Point of Control (POC)
De Point of Control komt overeen met de prijsrange met het hoogste aantal gestapelde boxen.
Hiermee kunt u de prijsrange zien waarin het aandeel het langst is gebleven.

De Value Area (VA)
Met de Value Area kunt u prijsniveaus identificeren die het merendeel van de boxen omvatten (doorgaans 70%).
Net als bij de POC kunt u hiermee snel prijsklassen identificeren waar de aandelenkoers het grootste deel van de dag is gebleven.

Het Volume Profile
Het Volume Profile geeft het totale verhandelde volume in elke prijsklasse weer.
Het kan daarom afwijken van de Market Profile boxen die weergeven hoelang de koers in deze prijsranges heeft doorgebracht.

De Initial Balance
De Initial Balance komt overeen met de eerste koersen van het profiel, doorgaans de eerste twee periodes (letters A en B, het eerste handelsuur van de dag).
Hiermee kunt u snel de prijsniveaus identificeren die direct na de opening van de markt worden bereikt.

Singles
Singles vertegenwoordigen prijsranges die in een bepaalde periode door de koers zijn overschreden zonder opnieuw te zijn bezocht.
Deze niveaus kunnen worden geïnterpreteerd als doorbraken na het overschrijden van steun- of weerstandsniveaus.

Poor Highs en Poor Lows
Poor Highs en Poor Lows komen overeen met situaties waarin een uiteinde van het profiel meerdere boxen bevat (of in de hoogste/laagste prijsrange, of die daar direct onder/boven).
Deze niveaus helpen bij het identificeren van mogelijk onafgeronde activiteit op bepaalde prijsniveaus, die daarom steun- of weerstandsniveaus kunnen vertegenwoordigen.

Analyseer de Market Profile over meerdere jaren
Met ProRealTime kunt u met de Premium-versie tot wel 1 miljoen historische candlesticks weergeven waarmee u Market Profile signalen kunt analyseren op basis van meerdere jaren aan historische intraday-gegevens.
